
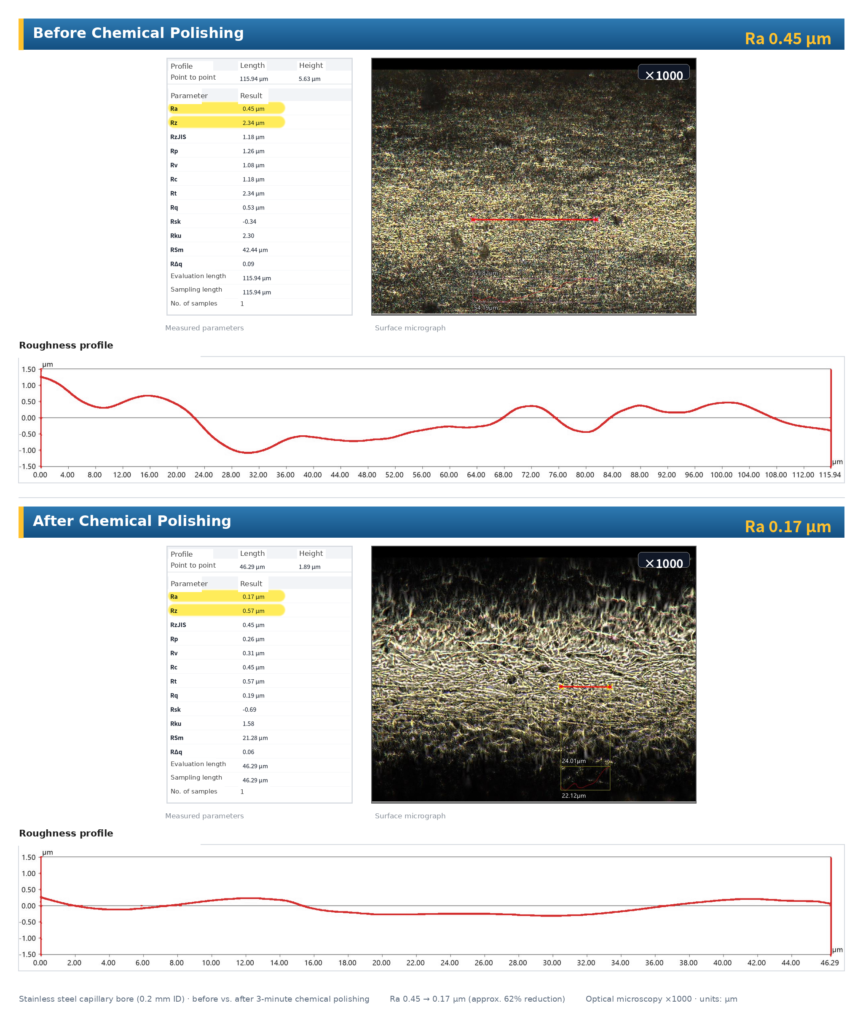
When engineers first contact us about internal surface treatment, the opening question is almost always the same: “How low can you get the Ra?” It is a reasonable thing to check — but judging internal surface quality by this one number leaves important factors out of view. This article looks at what surface roughness (Ra) does and does not tell you, and at the factors that actually govern component performance in flow meters, sensors and semiconductor fluid lines.
A low Ra can be reached by mechanical polishing, too
Let’s start with a fact worth stating plainly: if the goal is only to reduce surface roughness, chemical polishing is not the only way to get there. Magnetic abrasive finishing (MP), for example, can reach around Ra 0.1 µm even inside ultra-fine bores. A low Ra, by itself, is not something unique to chemical polishing.
This matters when selecting a process. If candidate methods are compared on Ra alone, the essential difference between mechanical and chemical polishing never enters the evaluation — because that difference lies in territory Ra does not measure.
Ra evaluates the shape of a surface — nothing more
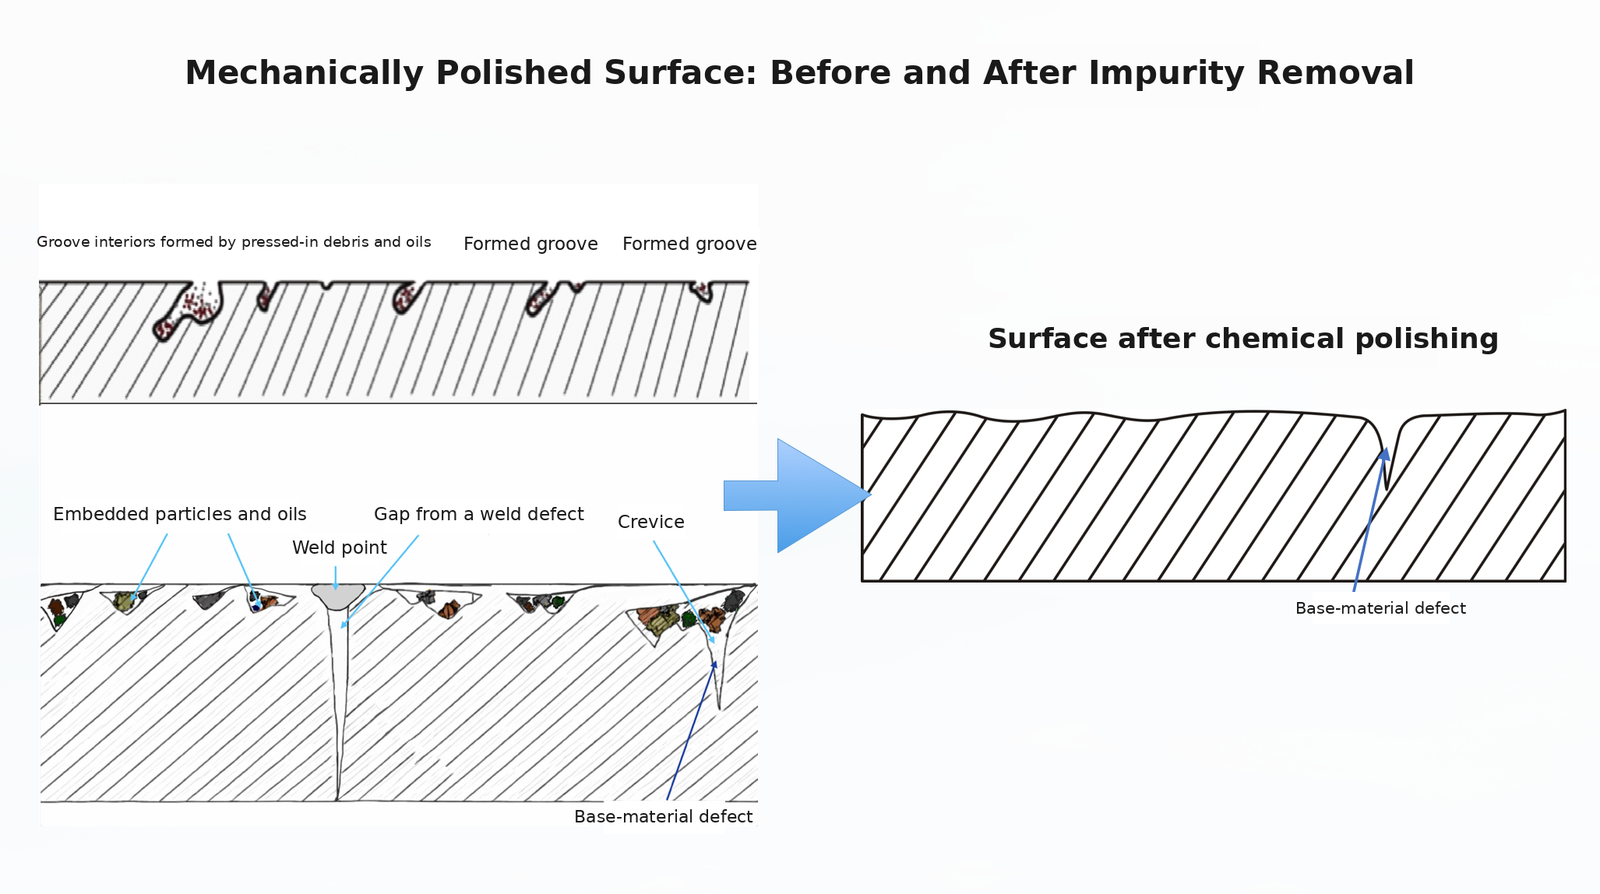
Ra averages the height of surface irregularities into a single number. It evaluates the geometry of a surface, and carries no information about the surface’s chemical state. The two sides line up as follows.
| What Ra shows | What Ra does not show |
|---|---|
| Average height of surface irregularities | Surface Cr/Fe ratio (an indicator of corrosion resistance) |
| Smoothness to sight and touch | Presence of a damaged layer and residual stress |
| A rough proxy for physical flow resistance | Embedded contamination — abrasive particles, oils |
Mechanical polishing removes material physically, using tools or abrasive particles. It reduces geometric roughness — but the act of removal itself changes the surface. It work-hardens a thin layer (the damaged layer), leaves residual stress in the material, and can press abrasive grit and oils into microscopic recesses. None of this appears in an Ra measurement.
What governs component life is the chemical state of the surface
In flow meters, sensors and semiconductor fluid lines, component life and reliability are rarely decided by the absolute Ra value. Three aspects of the surface’s chemical state do most of the work.
1. Cr/Fe ratio — a measure of passive-layer quality
Stainless steel resists corrosion through the passive oxide layer that forms on its surface. The higher the proportion of chromium oxide in that layer — and the lower the proportion of iron oxide — the denser and more stable the layer, and the better the corrosion resistance. The Cr/Fe ratio, together with the CrOx/FeOx ratio, puts a number on this.
In the semiconductor industry, SEMI F19 defines acceptance criteria for this surface state. For high-purity (HP) and ultra-high-purity (UHP) grades, the standard requires analysis of three items: total Cr/Fe ratio, CrOx/FeOx ratio, and oxide layer thickness. The UHP acceptance criteria are a Cr/Fe ratio above 1.5 and a CrOx/FeOx ratio above 2.0.
The key point here: mechanical polishing changes surface shape, but not surface chemistry. Before and after removal, the Cr/Fe ratio is essentially unchanged. Chemical polishing, by contrast, works through a controlled dissolution reaction — it acts directly on the surface’s chemical composition and can raise the Cr/Fe ratio. This is an effect that mechanical methods cannot deliver, as a matter of principle.
Third-party measured values
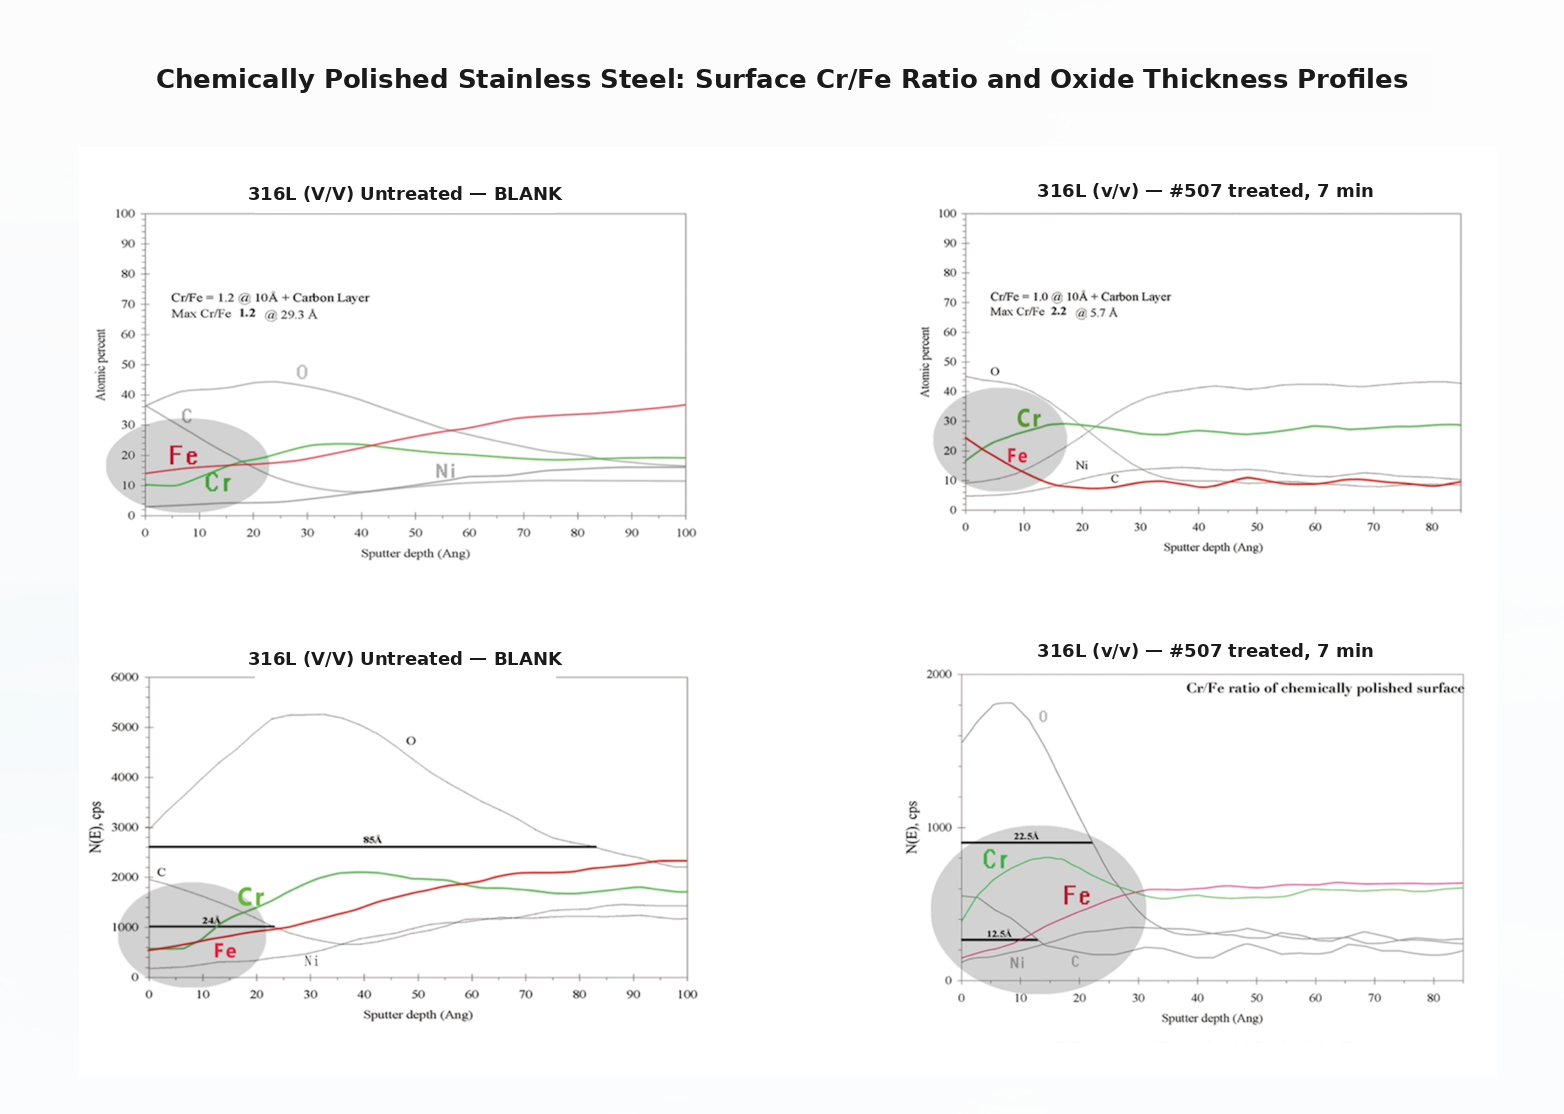
We commissioned third-party analysis of our chemical polishing process from RJ Lee Group (USA). The results are as follows.
| Item | Untreated | After chemical polishing | UHP acceptance criterion |
|---|---|---|---|
| Cr/Fe ratio (XPS) | 0.5 | 1.6 | Above 1.5 |
| CrOx/FeOx ratio (XPS) | 0.6 | 2.3 | Above 2.0 |
| Oxide layer thickness (AES) | 85 Å | 22.5 Å | ─ |
On the untreated surface, both ratios sit below 1.0 — short of even the HP grade. After chemical polishing, both meet the UHP acceptance criteria.
Beyond the ratio: where the chromium sits
A passive layer has a composition profile through its depth, so a single ratio cannot tell you where in the layer the chromium is concentrated. AES (Auger electron spectroscopy) depth profiling is where the difference shows.
| Item | Untreated | After chemical polishing |
|---|---|---|
| Peak Cr/Fe ratio | 1.2 | 2.2 |
| Depth of the peak | 29.3 Å below the surface | 5.7 Å below the surface |
| Surface carbon contamination layer | 24 Å | 12.5 Å |
| Oxide thickness (carbon-corrected) | 61 Å | 10 Å |
| Analyst’s observation | Delaminated Fe–O layer noted | ─ |
The untreated material does carry an oxide layer — but it is a thick, iron-oxide-dominated one, and the laboratory’s report notes a delaminated Fe–O layer. The chromium is concentrated 29.3 Å below the surface, which means the outermost layer — the one the fluid actually touches — is iron-rich. Thick as it is, a layer like this functions poorly as protection, and its tendency to delaminate makes it a potential particle source.
After chemical polishing, that iron-oxide-dominated layer has been dissolved away, and the chromium peak has moved to 5.7 Å below the surface. In other words, the outermost layer in contact with fluid or gas is now built around chromium oxide. Surface carbon contamination also fell, from 24 Å to 12.5 Å.
For electropolished surfaces, an oxide thickness of 20 Å or more and chromium enrichment within the top 15 Å are commonly cited benchmarks. The 22.5 Å measured here meets that level, and the laboratory’s assessment states that both the oxide thickness and the Cr/Fe ratio fall within the range typical of electropolished stainless steel.
An electropolish-equivalent surface — on geometries electropolishing cannot reach
That assessment goes to the heart of why we use chemical polishing. As discussed below, electropolishing is physically impractical on ultra-fine bores and on convoluted interiors such as bellows. Achieving a surface chemistry equivalent to electropolishing, on internal geometries that electropolishing cannot reach — that is our technical position.
* Measured by RJ Lee Group (USA). Test specimens (US-made SUS316L) were supplied by KAMEHA; the chemical polishing was carried out jointly with a partner company. Analysis per SEMATECH 91060573B (AES) and SEMATECH 90120403B (XPS).
* These figures are measured results of our chemical polishing process, obtained on a different product and material, and are provided for reference. Achievable values also depend on base-material quality and processing conditions.
2. Residual stress and the damaged layer — potential starting points for corrosion
A mechanically finished surface carries microscopic strain (residual stress) and a work-hardened layer whose crystal structure has been altered. A surface in this state struggles to form a uniform passive layer, and it is prone to localized corrosion such as pitting. Because chemical polishing removes material by dissolution, it strips away the damaged layer itself, exposing the base metal’s uniform crystal structure.
3. Embedded contamination — what cleaning alone cannot remove
During mechanical polishing and tube drawing, abrasive particles and oils can be pressed into microscopic recesses in the surface. Cleaning alone cannot fully remove them. In service, they can shed and become particle sources; in analytical applications, they can cause sample adsorption and carryover. Chemical polishing dissolves the surface itself, removing embedded contamination at its root.
The analysis above reflects this as well: the surface carbon contamination layer fell from 24 Å to 12.5 Å. SEMI standards likewise limit the amounts of carbon, sulfur, phosphorus, nitrogen and silicon at the outermost surface for HP and UHP grades — surface cleanliness stands alongside corrosion resistance as an acceptance item.
When a flow meter or sensor starts returning questionable readings, the cause is often not the instrument itself but corrosion or contamination on the internal surface of the connected tubing. In semiconductor equipment handling aggressive acids, ultrapure water and high-purity gases, the chemical state of the internal surface bears directly on the reliability of measurement data.
Where electropolishing (EP) reaches its limits
From the standpoint of chemical surface treatment, electropolishing (EP) is also a candidate. EP dissolves the surface through an electrochemical reaction, and it too can improve the Cr/Fe ratio. But electropolishing carries a physical constraint: an electrode must be brought to the workpiece.
In an ultra-fine bore of Ø0.2 mm, inserting an electrode is difficult in the first place. In the convoluted interior of a bellows, bringing an electrode into uniform proximity is harder still. Before the chemistry is even in question, electropolishing is constrained at the stage of simply reaching the internal surface.
Chemical polishing (CP) needs no electrode — the reaction proceeds wherever the chemistry contacts the surface. It can act inside ultra-fine bores and complex geometries, which is why it can address territory that neither mechanical polishing nor electropolishing handles well.
Measuring Cr/Fe — and why the base material matters
Measuring the Cr/Fe and CrOx/FeOx ratios is not something that can be done casually, the way Ra can. It requires precise surface analysis by XPS (X-ray photoelectron spectroscopy) or AES (Auger electron spectroscopy), and the laboratories capable of performing this analysis to a high standard are limited worldwide. SEMI standards likewise position XPS as the preferred evaluation method. We use measurement data from SEMI-compliant third-party laboratories such as RJ Lee Group (USA) as our benchmark.
One more point should be stated openly: the Cr/Fe ratio a surface reaches depends heavily on the base material, not only on the polishing process. Apply the identical treatment and the result will differ from one base material to another — semiconductor-grade high-purity material and general-purpose material will not arrive at the same Cr/Fe ratio. Chemical polishing does not deliver a fixed number regardless of what it is applied to.
Presenting a specific Cr/Fe figure without stating that premise is not, in our view, sound technical communication. A number should be evaluated together with its measurement conditions — the base material, the process, and the laboratory.
What to check before specifying an internal surface treatment
Taken together, the points above suggest a checklist that goes beyond the Ra value.
- Does the application actually call for a low absolute Ra — or for corrosion resistance and cleanliness?
- Is there data on the Cr/Fe ratio, CrOx/FeOx ratio and oxide thickness — and which laboratory measured it?
- At what depth in the layer is the chromium concentrated? (The ratio alone cannot tell you.)
- Was the data measured under the same conditions — product and base material — as what you will actually order?
- Can the process physically handle the geometry and dimensions — electrode access, chemistry access?
Ra remains a valid metric. But it cannot, on its own, describe the whole of internal surface quality. In applications where corrosion or contamination translates directly into degraded performance — flow meters, sensors, semiconductor fluid lines — the evaluation should extend to the chemical state of the surface.
About our chemical polishing
At KAMEHA, we chemically polish internal surfaces that mechanical polishing and electropolishing struggle to reach — Ø0.2 mm ultra-fine bores, bellows interiors — using independently developed dedicated equipment. Beyond smoothing, the process raises the Cr/Fe ratio and cleans the surface, improving corrosion resistance. Feasibility questions and sample requests are welcome.